Transportation Equity
Shifting Focus: Identifying Barriers to Oʻahu Mobility
Looking beyond conventional commuter data to understand how Oʻahu residents of all ages and abilities get to school, work, and beyond.
Related research products:
Our current understanding of how people move around Oʻahu is largely defined by how people get to work. While U.S. Census data shows that 66.6 percent of Hawaiʻi’s workforce drives alone to work, these statistics capture only a fraction of our island’s total mobility. We are left with significant questions about the other essential trips—trips to school, grocery stores, and medical appointments—that don’t fit into the standard 9-to-5 work day.
To fill these data gaps, we worked with Ward Research to deploy a comprehensive Oʻahu travel survey, with the goal of better understanding the mobility needs of residents of different ages, abilities and backgrounds.
Who We Surveyed
The survey, collected between September 4 and October 31, 2025, reached a total of 666 respondents. Surveys were shared through Ward Research’s online panel and Hawaiʻi Appleseed’s network, and were conducted through a mix of online completions (485) and mail-in surveys (181).
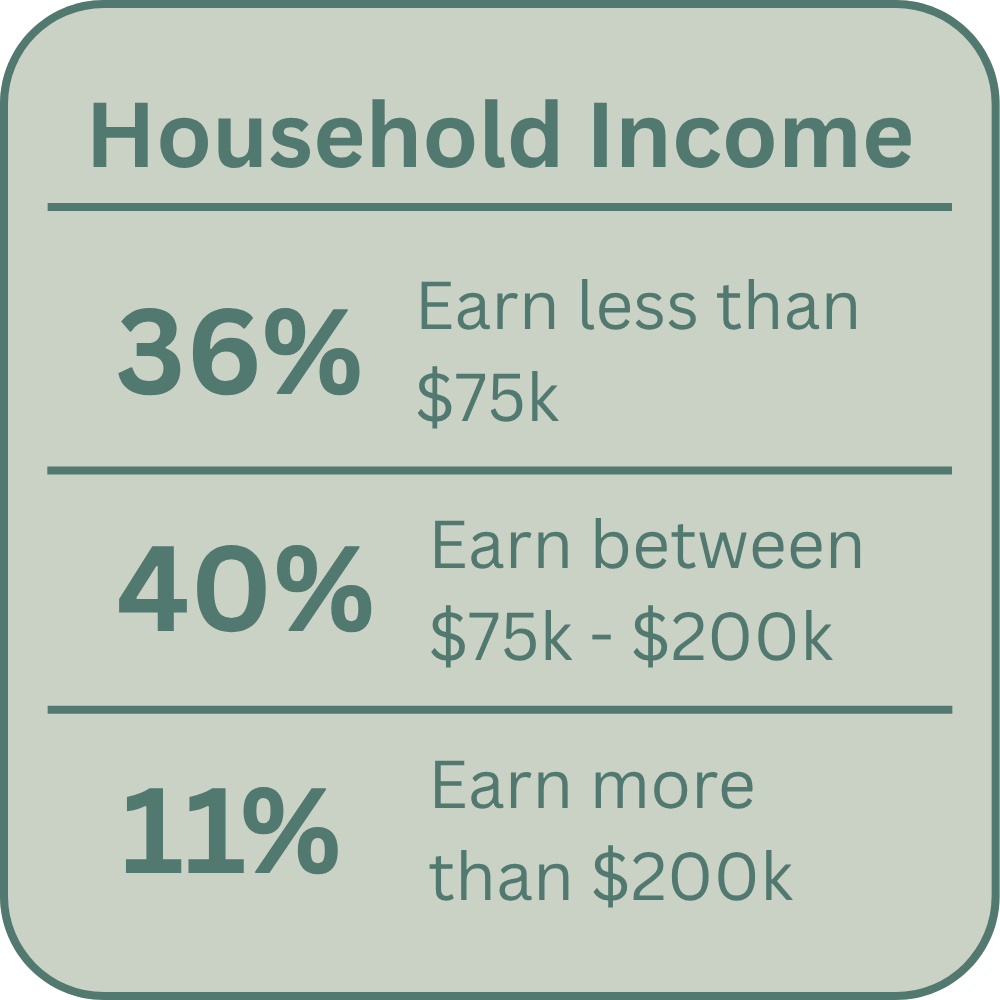
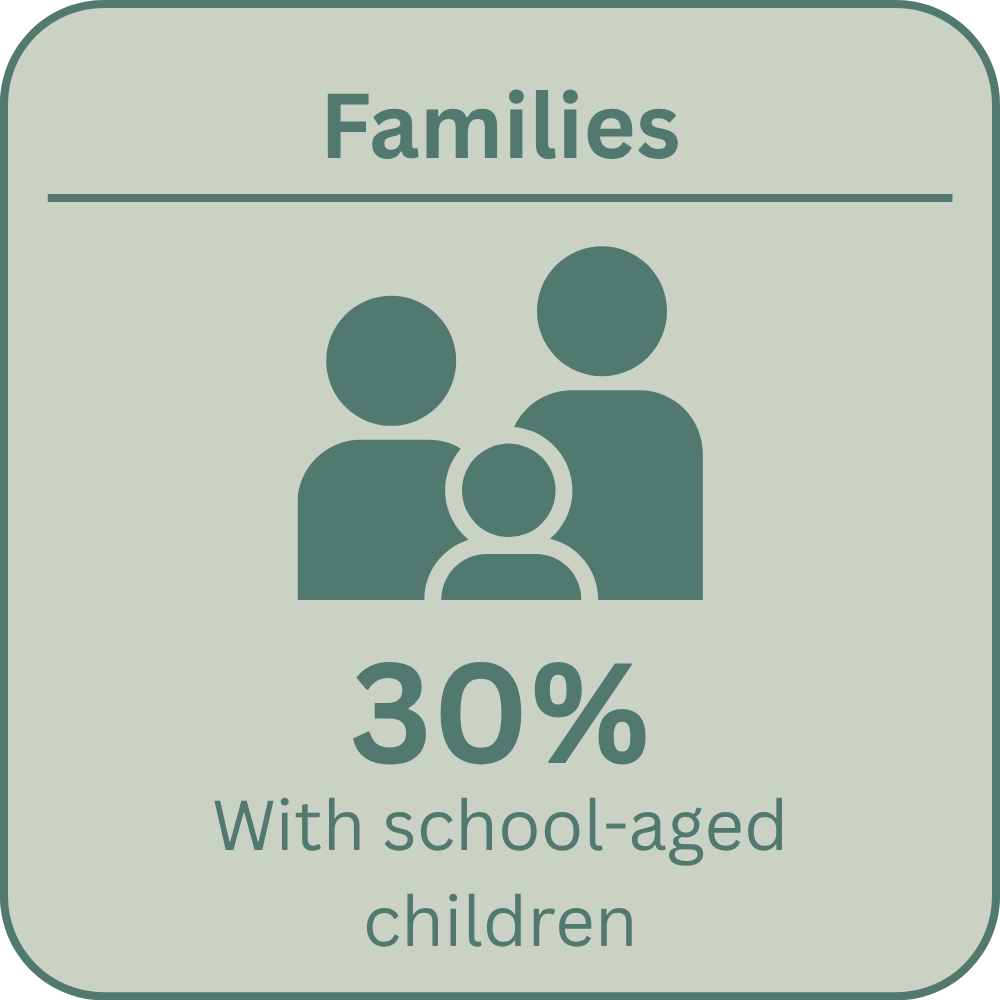
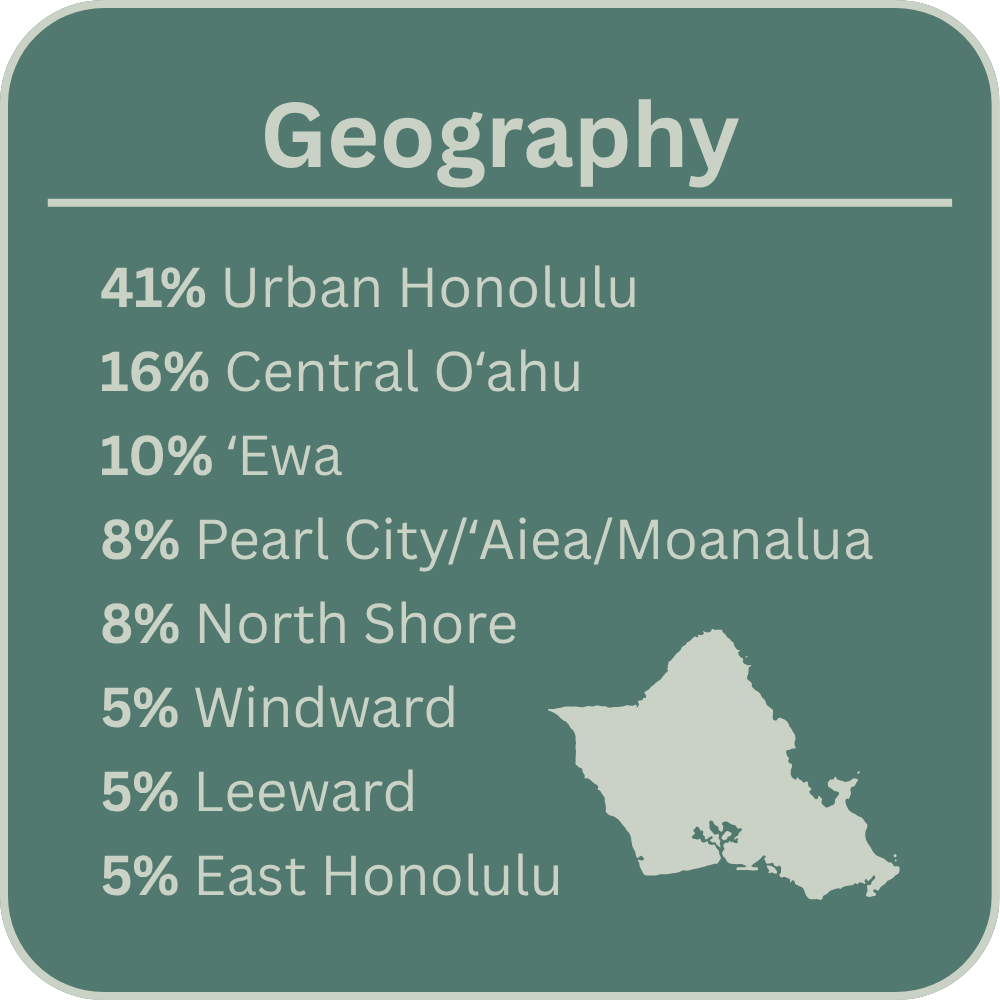
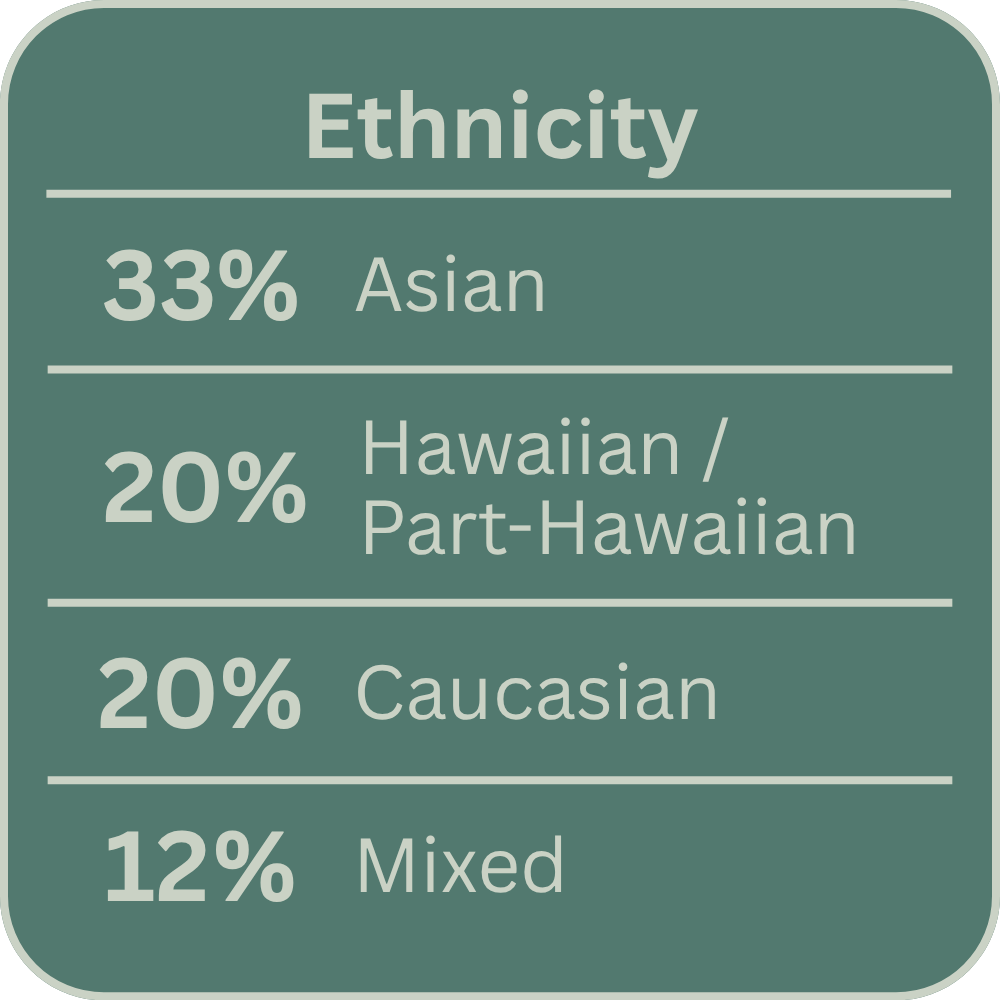
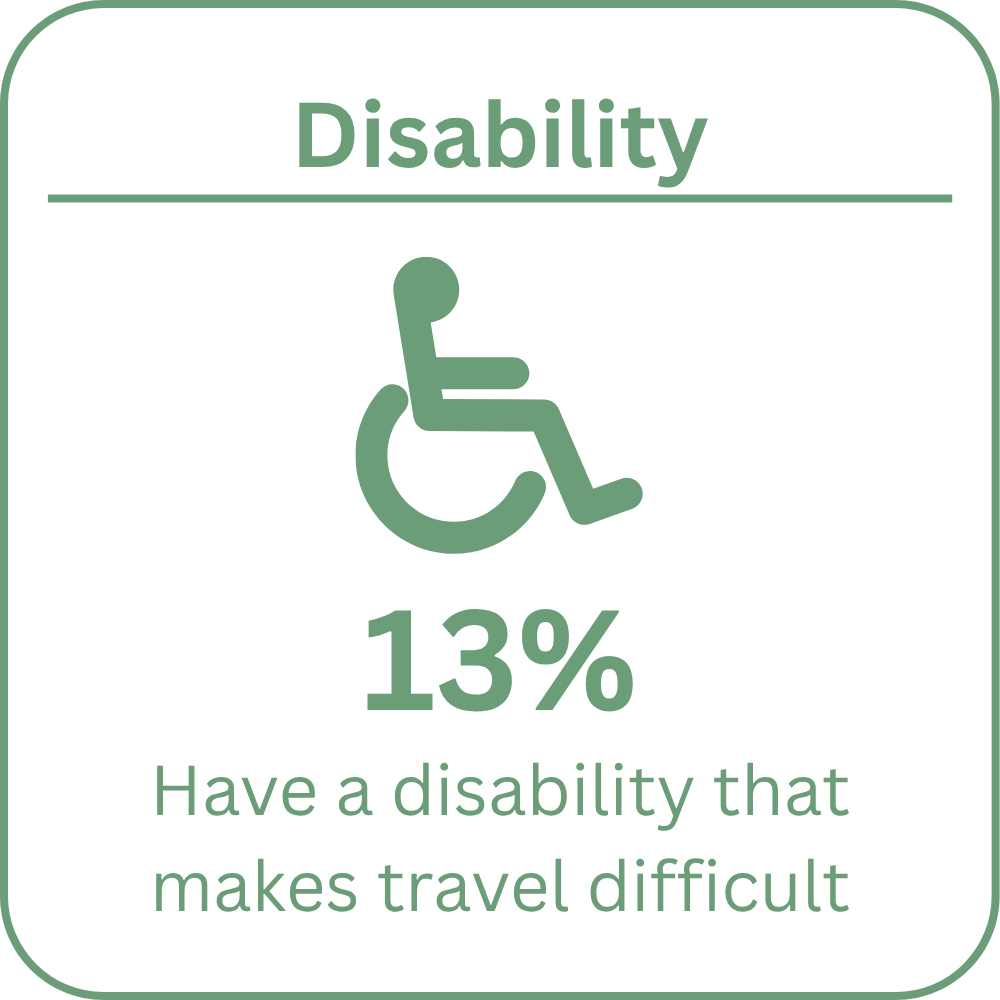
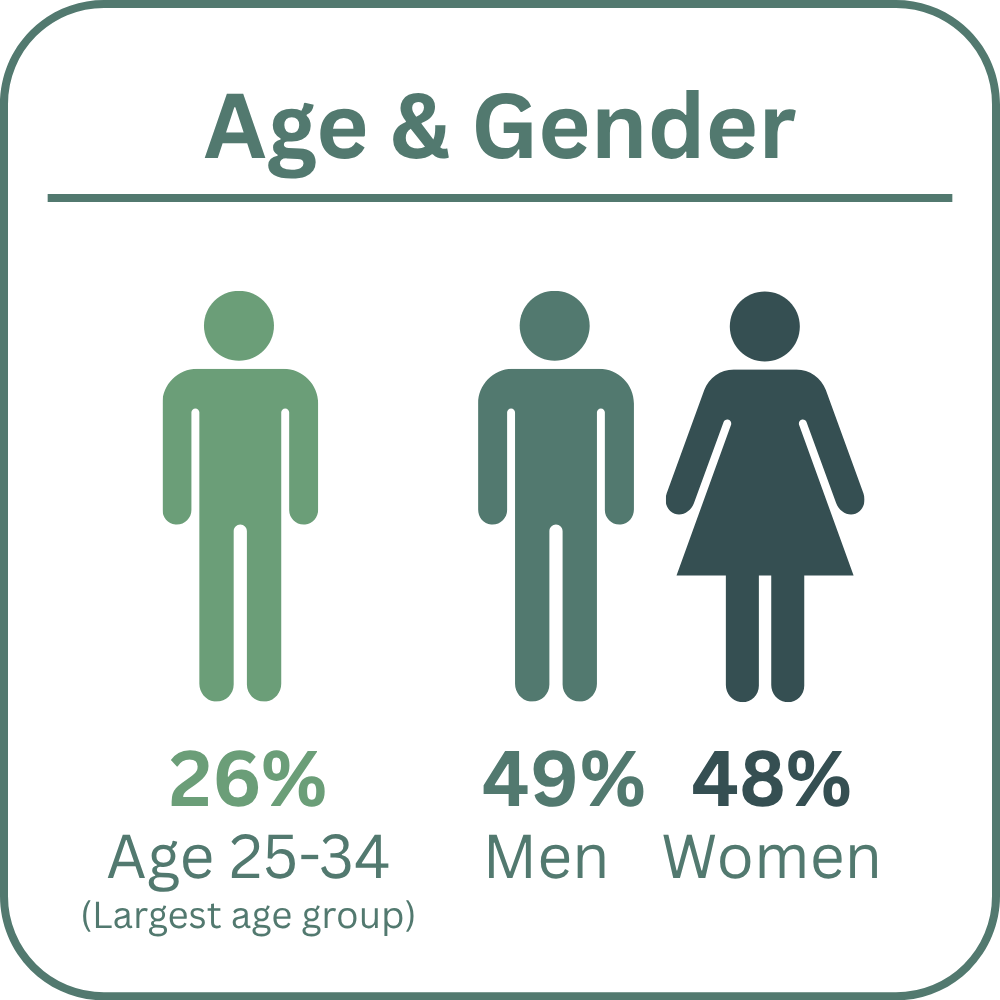
The following breakdown highlights the diversity of survey participants:
What We Learned
Across Oʻahu, personal vehicles are the primary mode of travel for both essential and recreational trips, though walking and public transit are vital for a significant portion of the community. While most residents are generally mobile, some frequently encounter barriers that make daily travel difficult or even impossible. The transportation challenges residents faced were greatly influenced by where they lived, their income, and household size. There were also shared concerns. Nearly half of all survey participants cited traffic congestion and long drive times as the primary transportation concern.
Mobility Gaps
Infrastructure: Only 50 percent of residents agree that their communities have enough safe and accessible sidewalks, bike lanes, bus stops, and bus routes (Figure 1). Residents in urban areas are more likely to disagree that there are enough safe sidewalks and bike lanes to encourage active transportation. Rural residents are more inclined to disagree that there are enough bus routes and stops to support transit usage.
Cost: Half of all respondents report that transportation costs (such as gas, parking, and bus fares) negatively impact their ability to reach essential destinations like the doctor or grocery store.
Car Dependency: On average, personal vehicles are the dominant mode for 68 percent of trips to work, 86 percent of trips to medical appointments and grocery stores, and 80 percent of trips to parks and beaches.
Figure 1. Safe And Accessible Transportation Infrastructure?
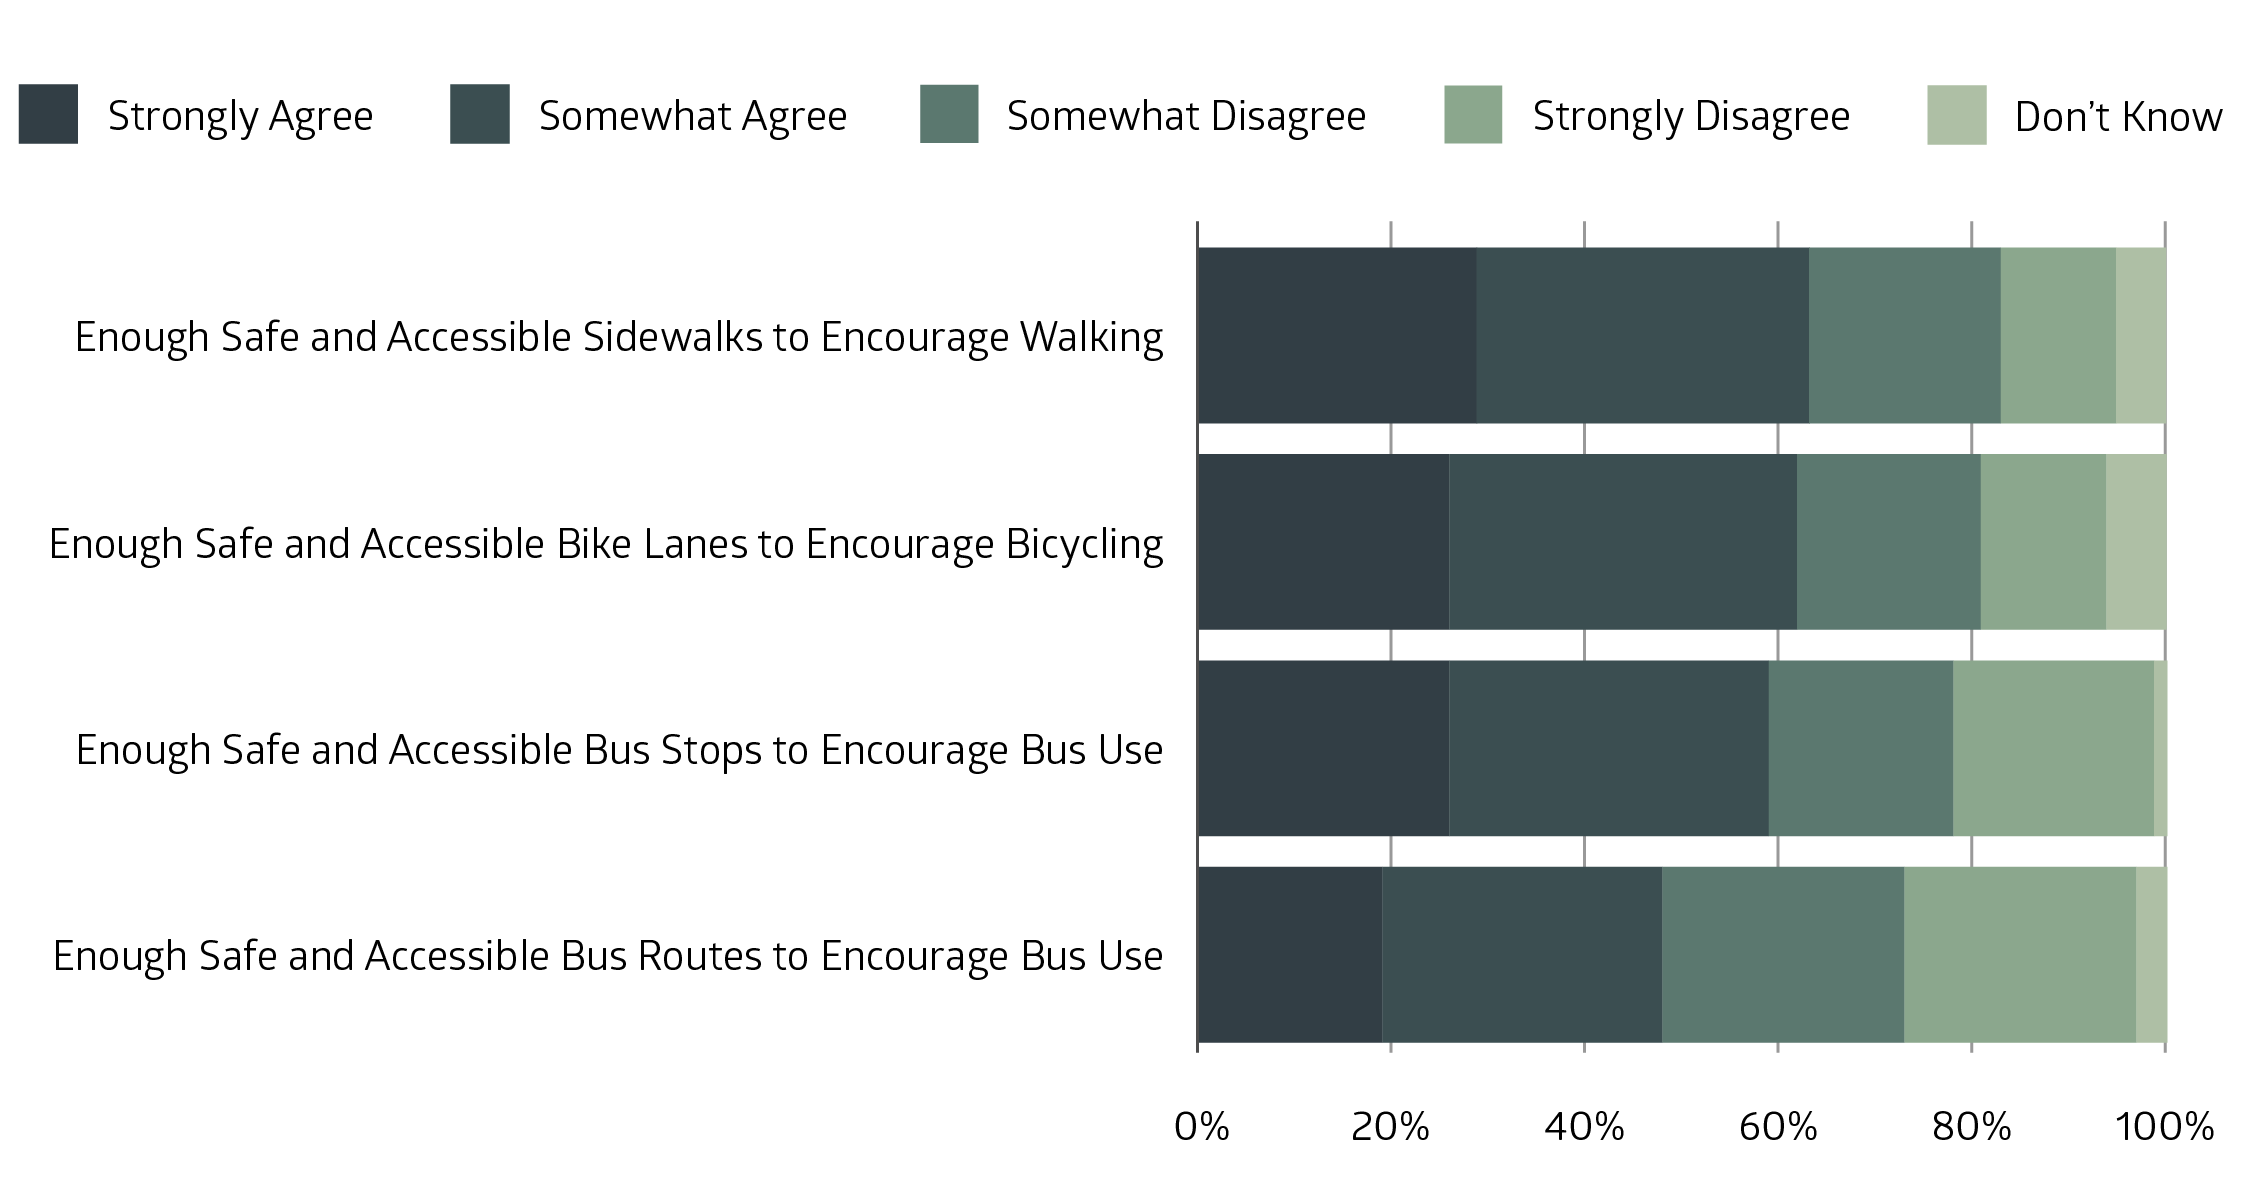
Figure 1. Percent of respondents who agree and disagree that there are enough safe and accessible bus stops, bus routes, bike lanes, and sidewalks to encourage mobility in their communities.
Access to Vehicles
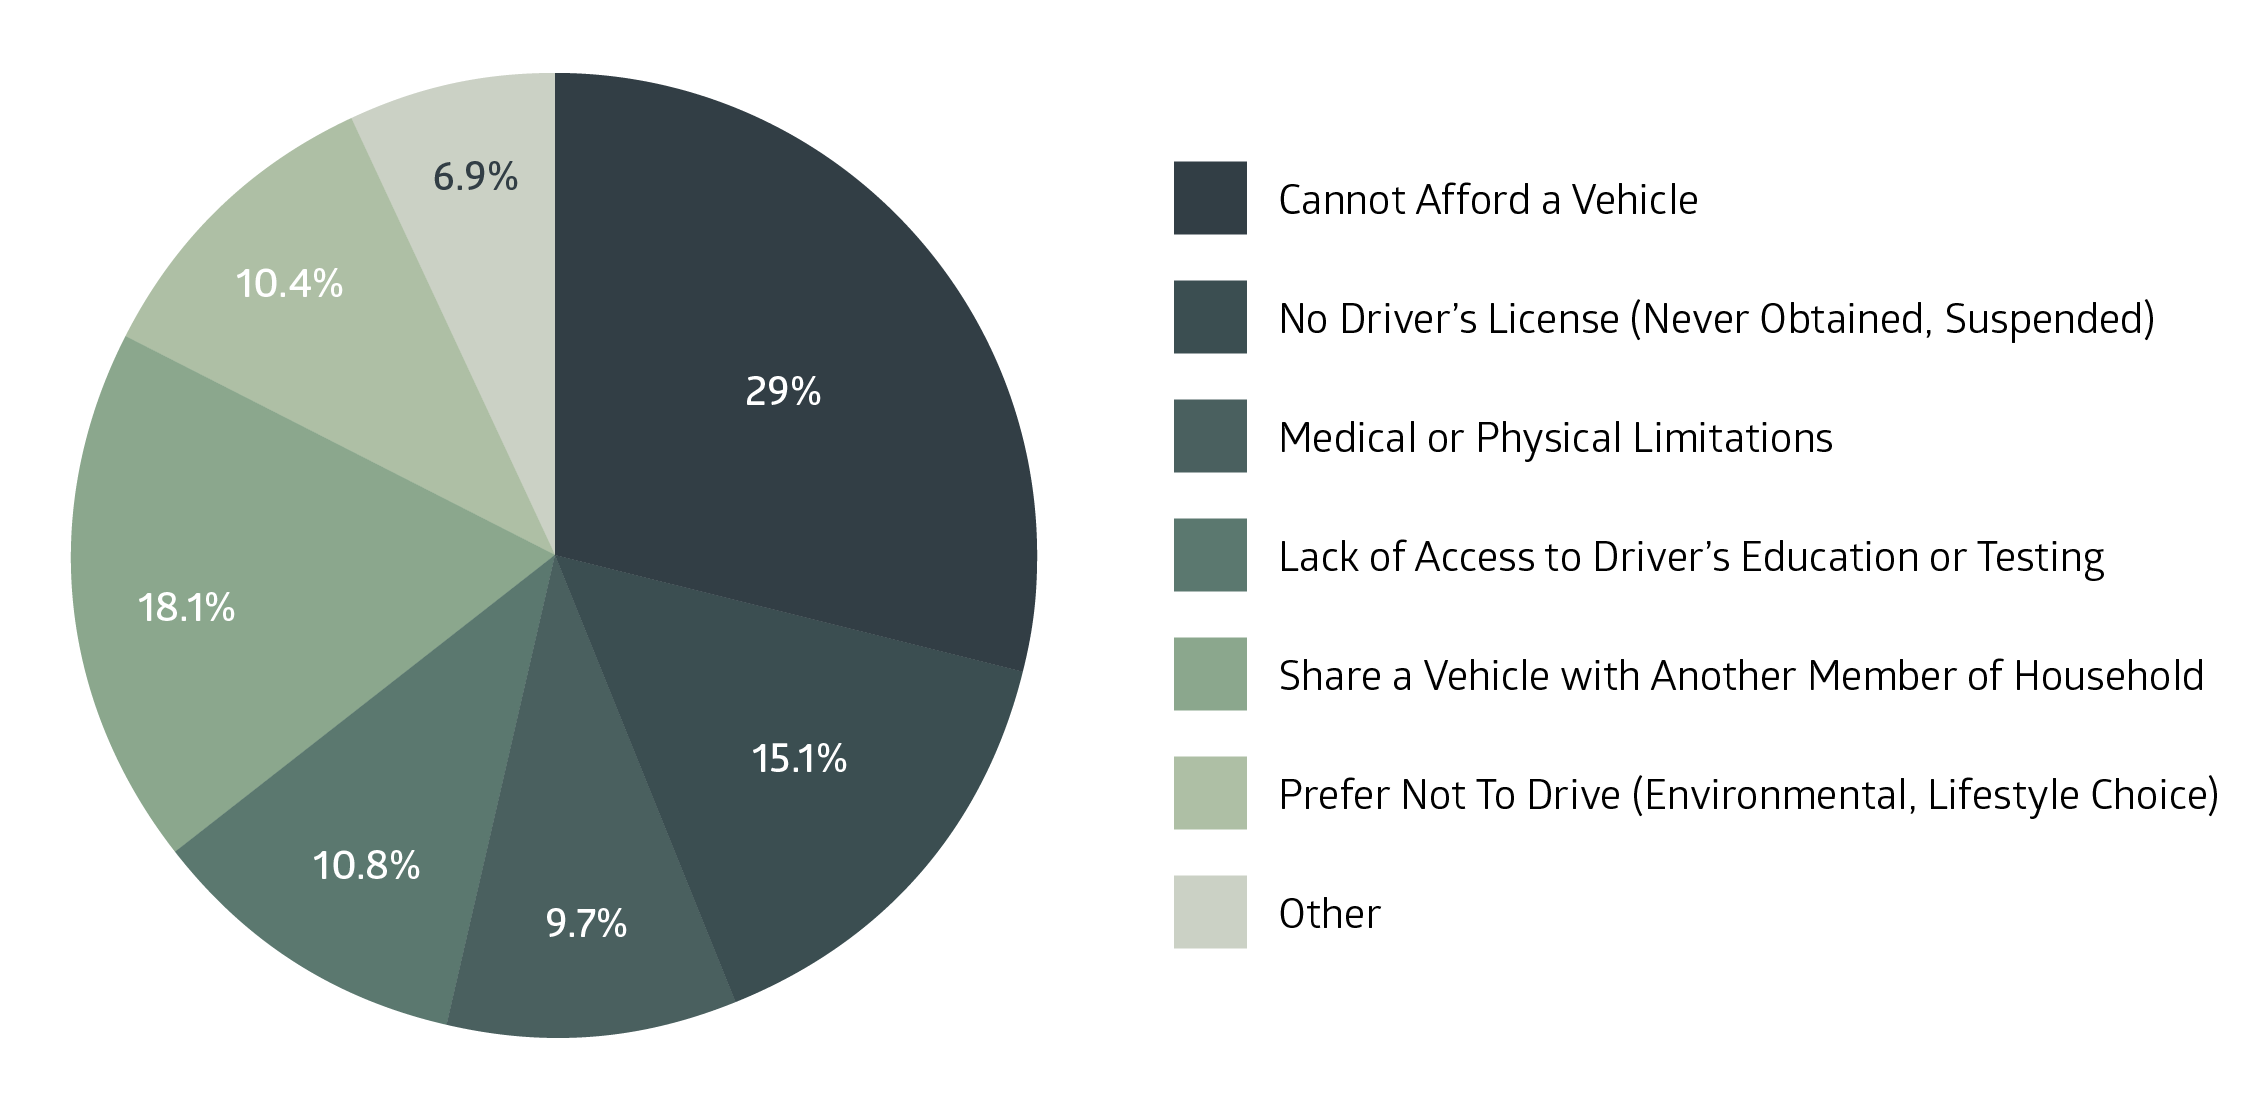
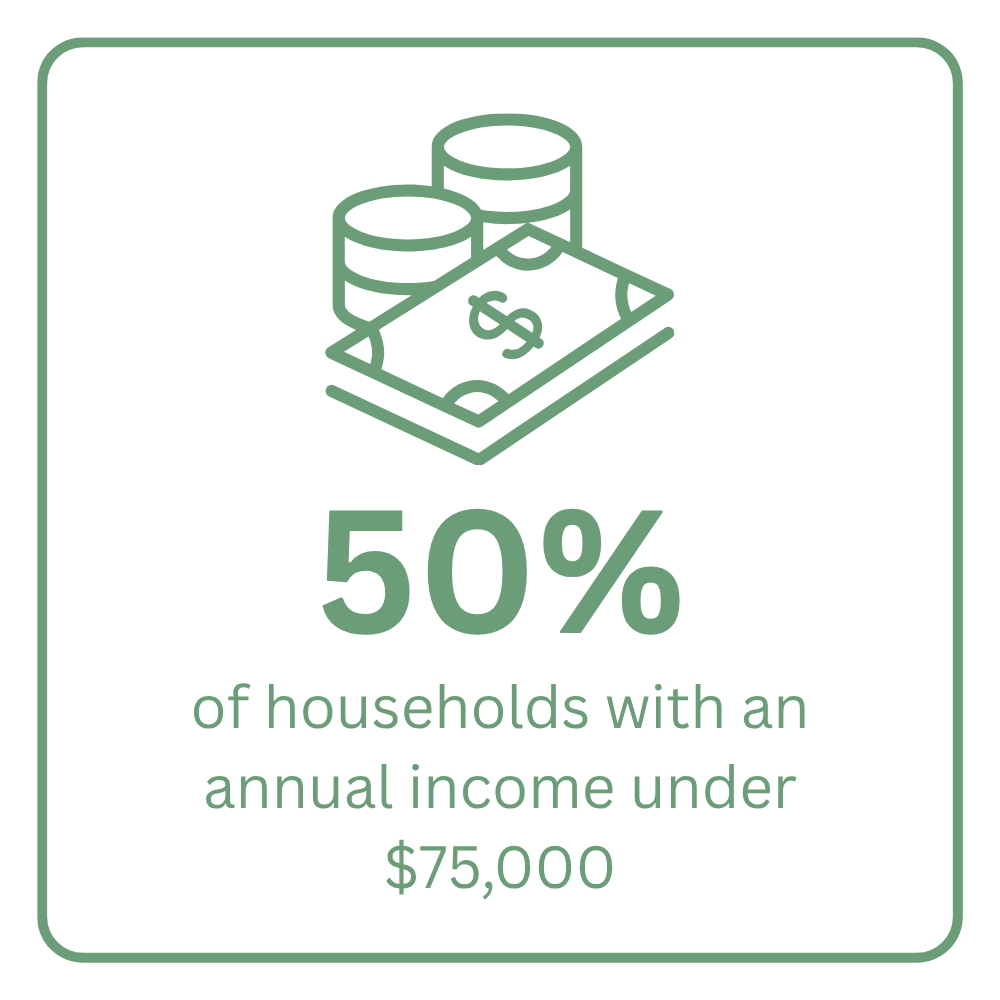
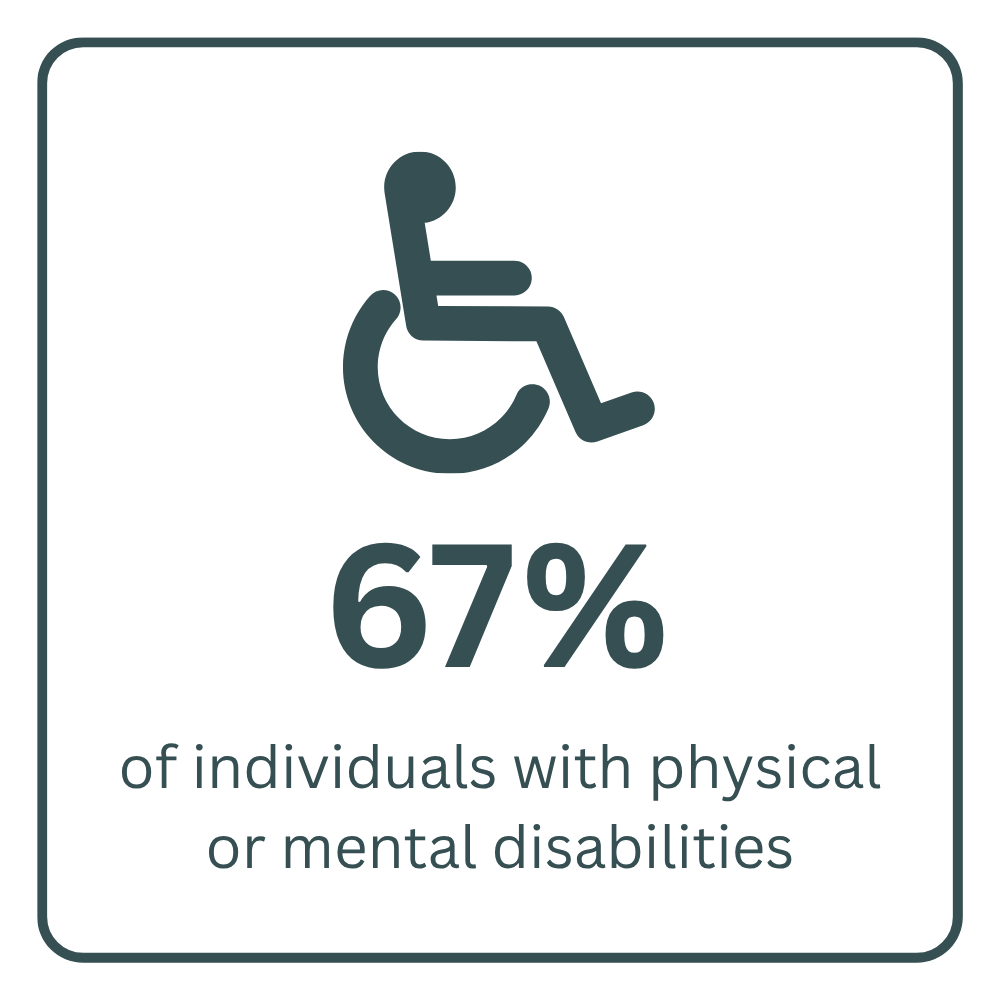
While 85 percent of survey respondents owned at least one car, access to a vehicle was not a reality for everyone. Individuals with disabilities or those with household incomes under $75,000 were significantly less likely to have a vehicle available. Twenty-eight percent of individuals from households with an income of $75,000 or below had zero cars at their home, while 30 percent of those with a disability had zero cars at their home. Of those who do not own a vehicle, the most common reason was the inability to afford one (Figure 2).
Figure 2. Primary Reasons For Not Owning A Car
Transportation Insecurity
Transportation insecurity occurs when barriers like a lack of vehicle access, unreliable transit, or high costs prevent someone from leaving their home when they need to. Recent national data shows that transportation insecurity is the most common of material hardship.
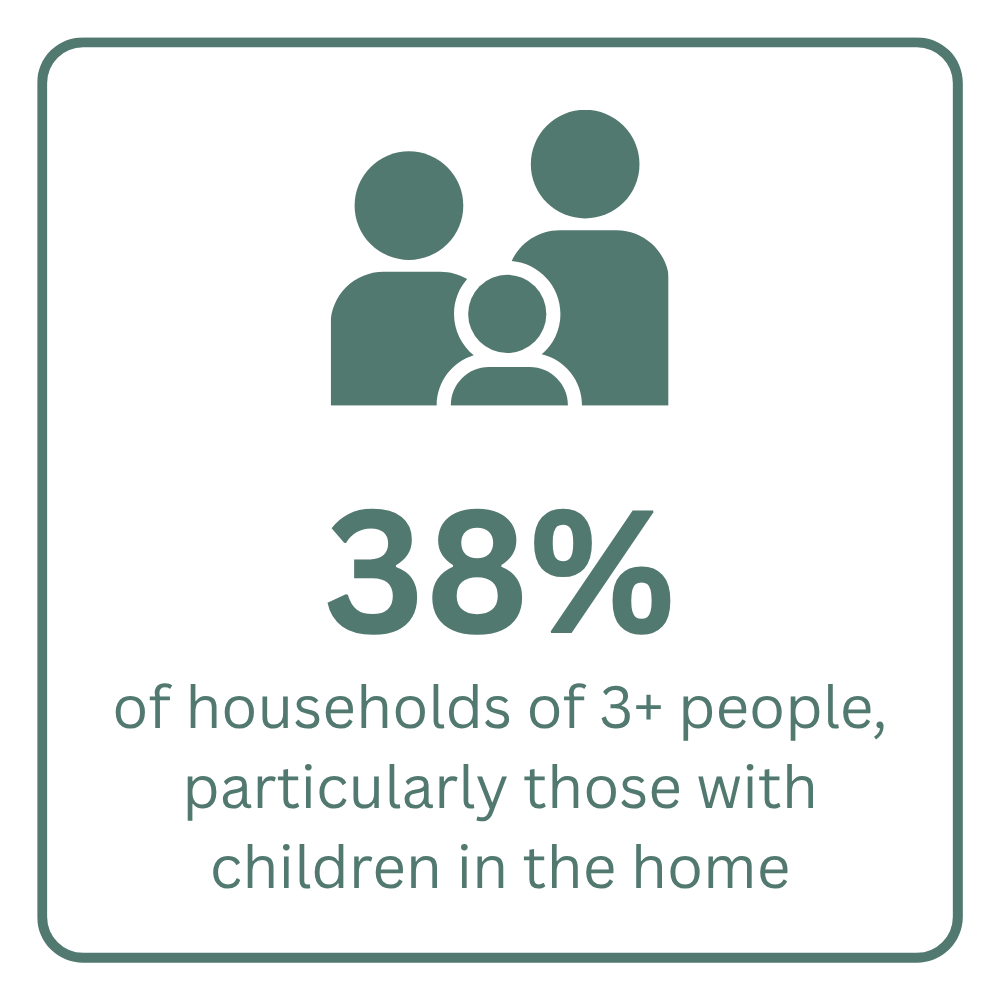
Nearly 1 in 4 of survey respondents indicated that they faced transportation issues so severe that they were unable to leave their homes at some point in the past month. This insecurity was most concentrated in the following groups:
A Closer Look: Mobility Needs by Region
Transportation access, mobility, and insecurity vary not only by demographic but by region. The interactive map below evaluates local infrastructure and key insecurity factors, providing a window into the specific barriers and opportunities within each region on Oʻahu.
Student Mobility Needs
Approximately one in three survey respondents have school-aged children in their household. The majority of these families rely on a family-owned vehicle to get students to and from school and extracurricular activities. Less than half of families said their children had the ability to walk, take public or school transportation, carpool with friends, or bike to school. However, alternative transportation modes are still being utilized by many students—though differently among age groups:
Elementary School Students: Younger students are more likely to walk to school compared to older age groups.
Middle School Students: Students at this level are more likely to utilize a school bus for their daily commute.
High School Students: Older students show a higher tendency to use TheBus or carpool by getting a ride from friends.
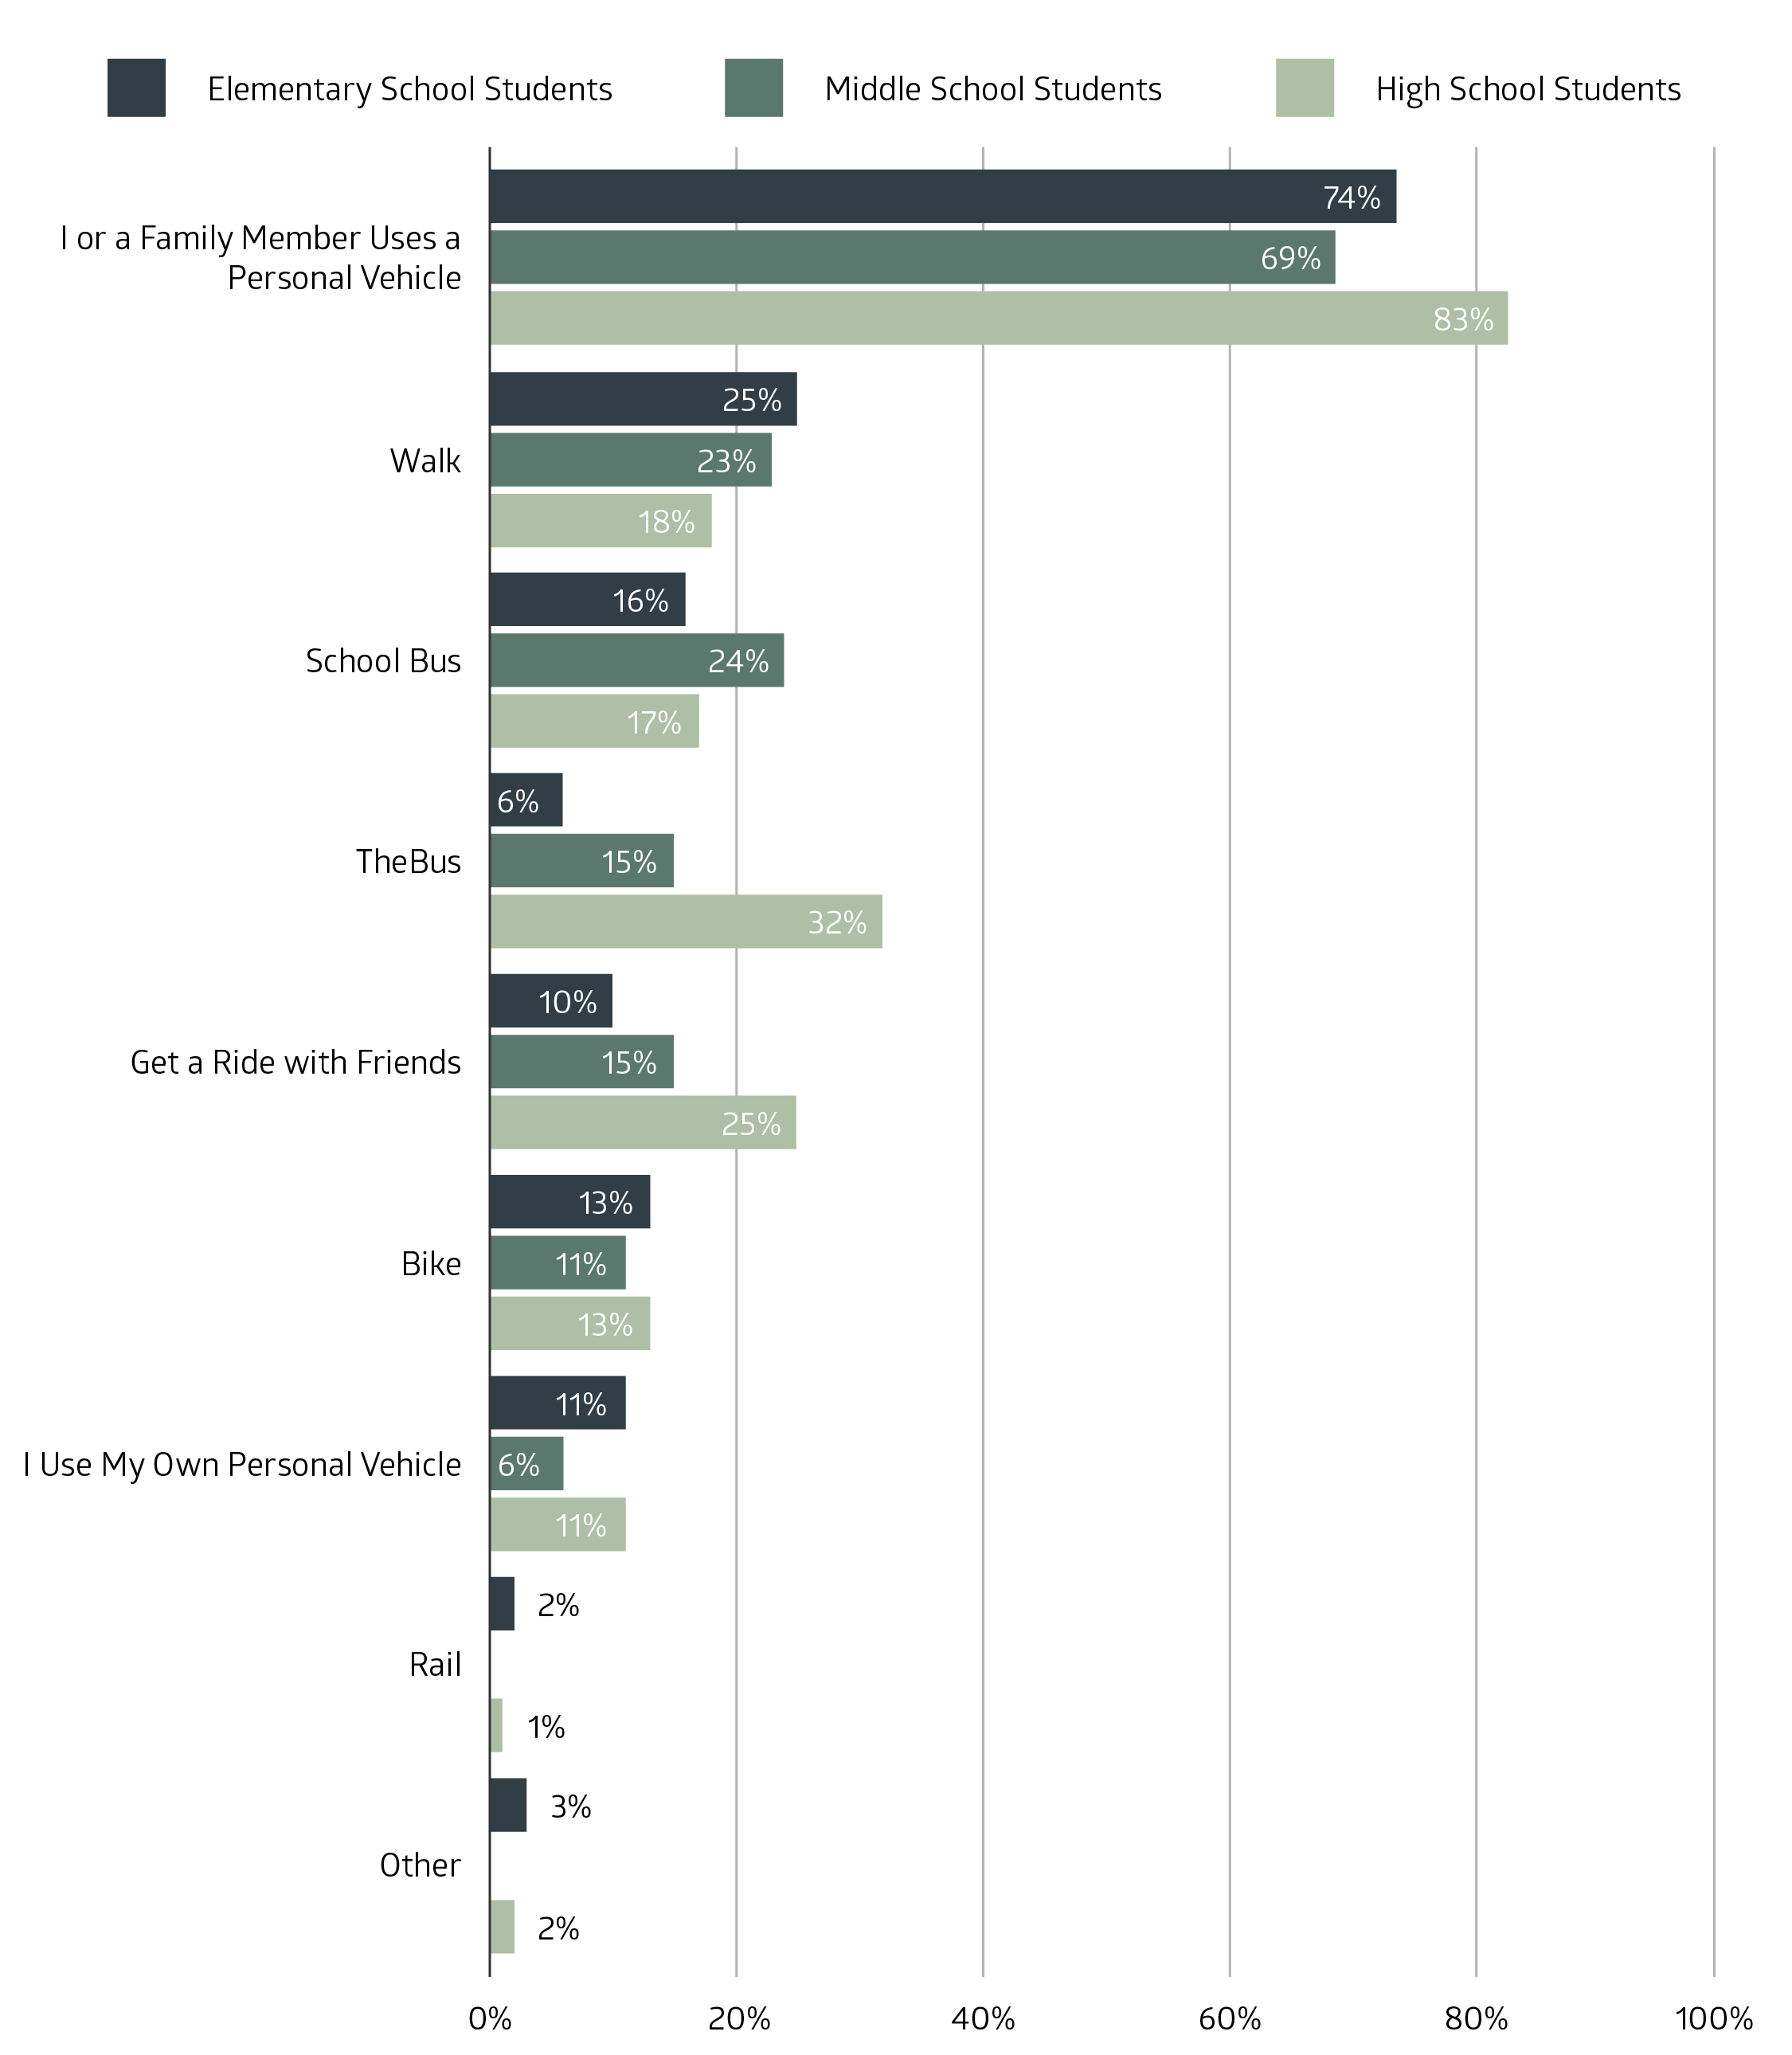
Figure 3. How Respondents and Their Students Get To and From School
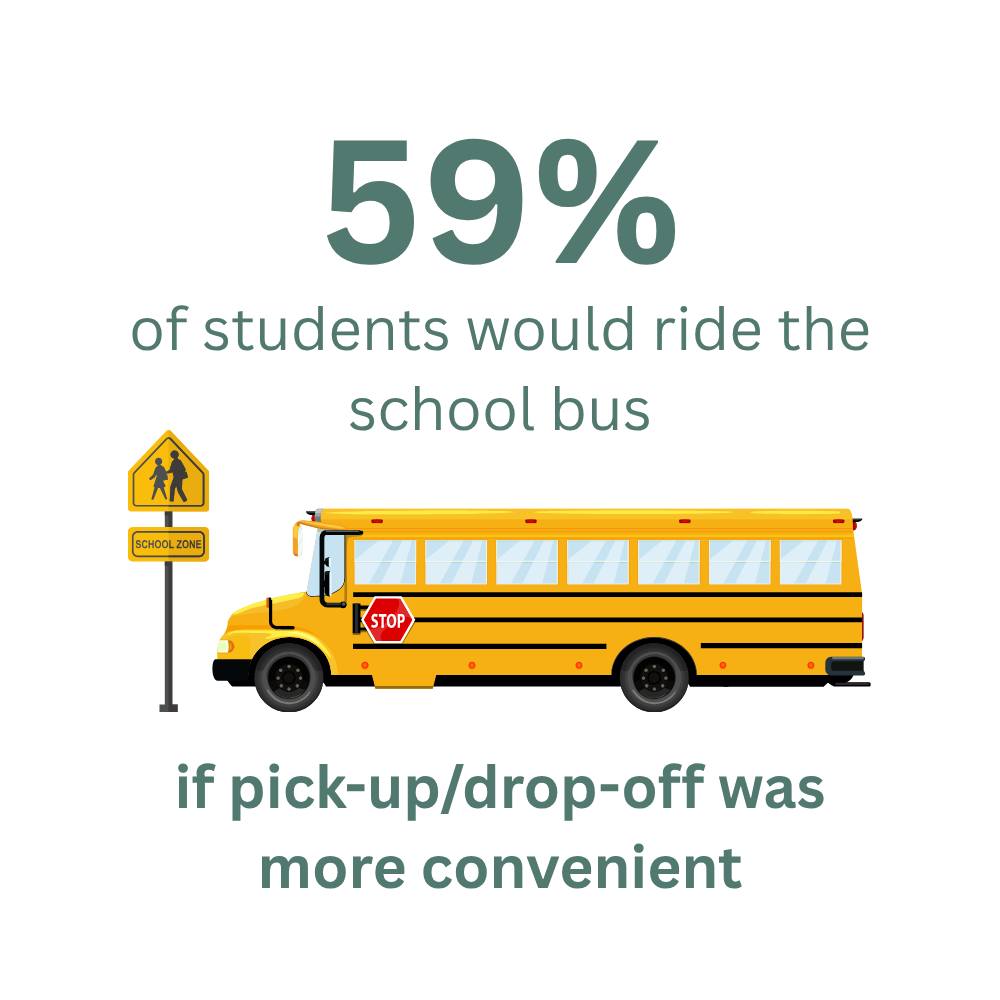
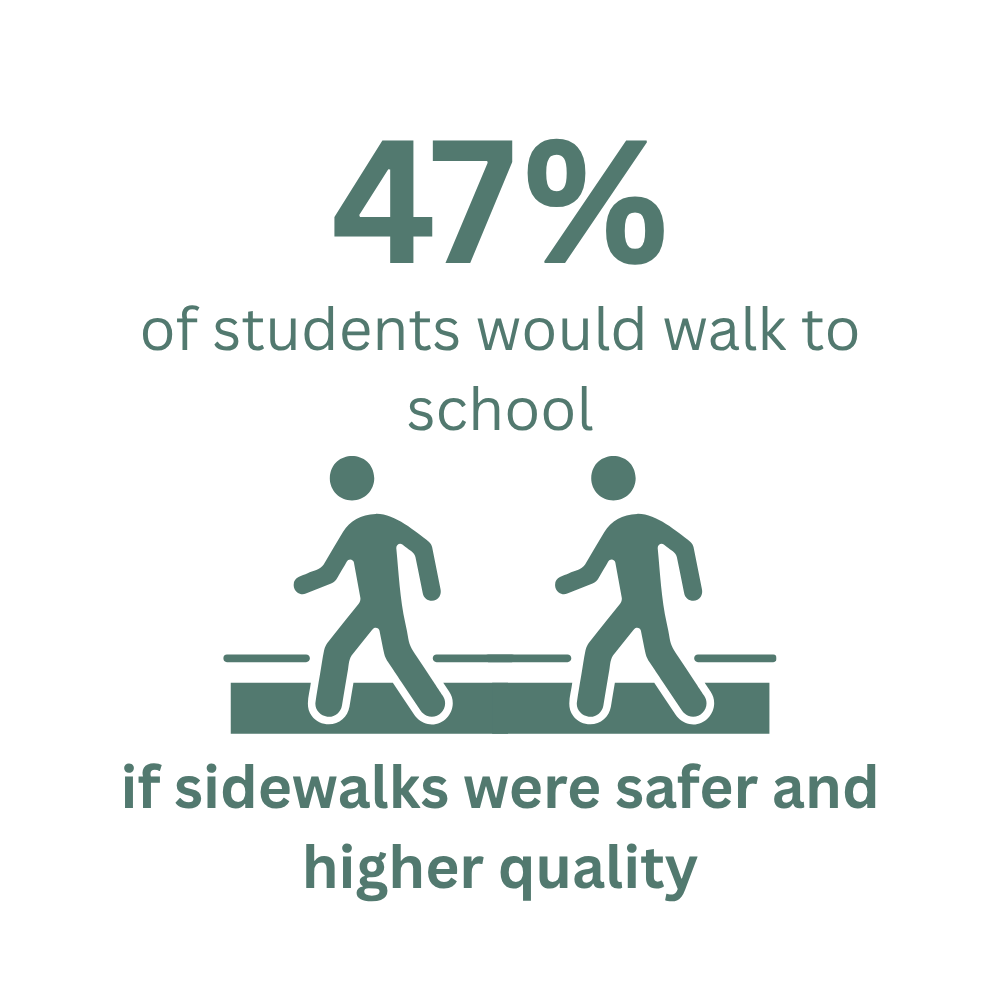
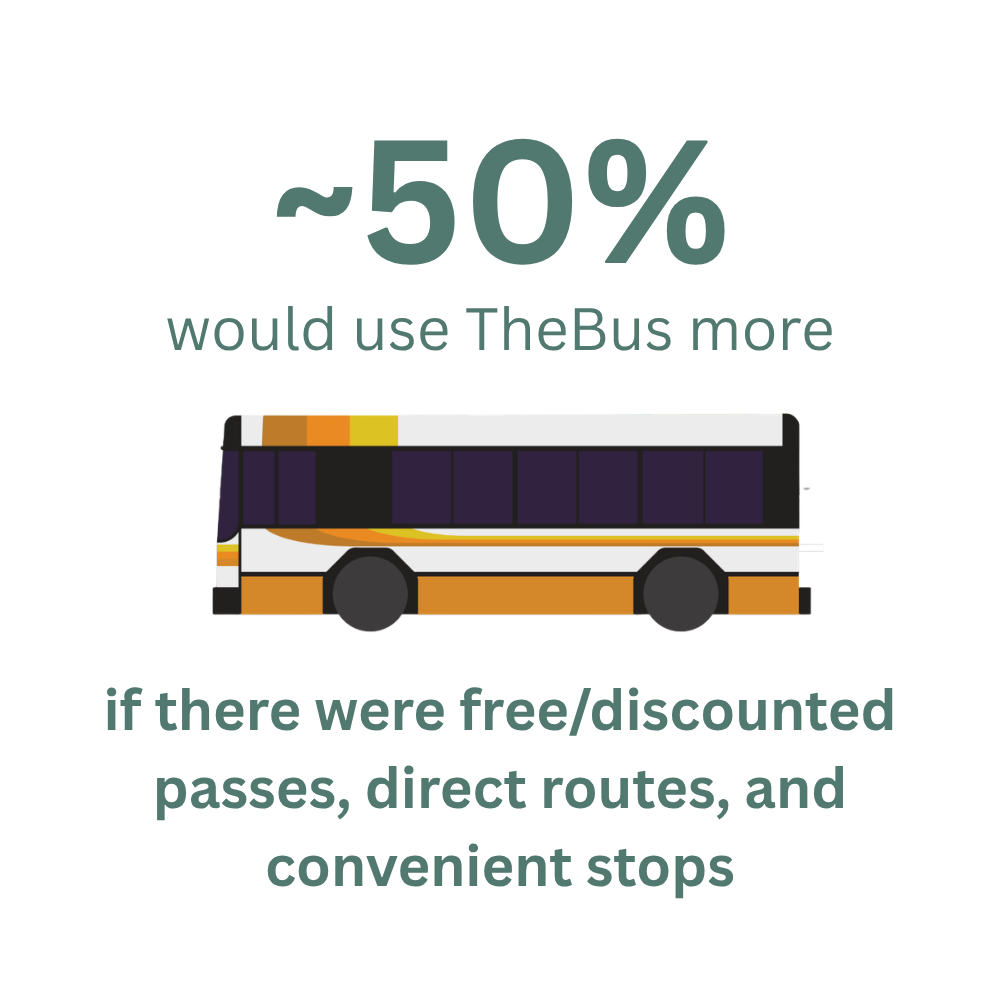
Survey results also indicated that many students would shift to alternative modes of transportation if certain improvements were made:
Policies to Move Oʻahu Forward
The results of our travel survey indicate that current transportation infrastructure and services are not meeting the diverse mobility needs of our island residents. While car dependency remains high, the significant percentage of residents facing transportation insecurity and the willingness of students to use alternative modes highlight a clear demand for more safe, affordable, and reliable multimodal options. To improve island-wide mobility, we recommend the following policies, targeted to high-need populations:
Individuals with Disabilities
Improve accessibility and safety of pedestrian infrastructure, with a focus on intersections.
Expand service for the Handi-Van.
Low-Income Households
Offer electric bike rebate and car-sharing programs.
Support transit-oriented and compact development.
Households with Keiki
Invest in school buses, pedestrian, bicycle, and transit infrastructure near schools, and subsidized transit passes for youth.
Travel survey completed with the support of the Robert Wood Johnson Foundation and Urban Institute’s Local Data for Equitable Communities Grant.